
|
|
|
 |
|
|
Patterns in Space Latitude | Area | Altitude | Habitat diversity | Hot spots | Productivity
The first trend that researchers of biological diversity discovered was that larger areas contain more species than smaller ones. This trend is not linear; the rate at which new species are found in larger areas slows as the size of the area increases (see the figure to the right). Known as the species-area curve, it can be used to estimate the number of species that are actually in the region being studied, and the curves of different regions can be compared to each other as well. These curves have been made for many different groups of organisms. There are several possible reasons for the number of species to increase with area. As a greater area is sampled a greater proportion of the total population is examined and species that are not present in the smaller areas are included in the larger ones. The curve will eventually level off at the actual number of species in the total area. Another reason for the trend could be that the pattern results from a balance between immigration and extinction, as in the theory of island biogeography (see the Theory section). Finally, it could be that as area increases different types of habitat are included and habitat diversity (see below).
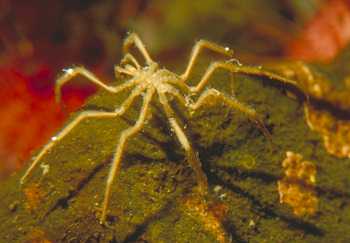
Diversity also changes with ocean depth. Despite the number of fish species found in the water, most marine diversity is actually found on the ocean floor. Diversity in the ocean increases with depth, but only up to a point. After that, diversity begins to decreases again.
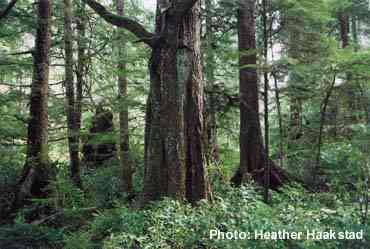
As more types of habitats or terrain are included in an area, more species will be found. Different habitats have different species, so more habitats would mean a greater total number of species. For instance, more species would be found in an area that included both forest and an adjacent grassland than an area that only included the forest.
"Hotspots" are areas that are of exceptional interest. There are different types of hotspots; although high diversity is certainly enough to make a region a hotspot, the number of rare species or the number of scientifically unusual species that are found there would also be enough. Most global hotspots lie near the equator, but Canada has hotspots as well: for example, the Pacific coast is rich in seaweed species, while the southern Atlantic coast has more stickleback fish species than anywhere else in the world. Why an area is a hotspot depends upon any number of circumstances, including any of the factors given above. Hotspots are often singled out for conservation, since many species can be protected at once.
|
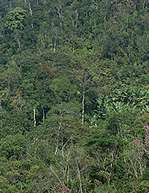
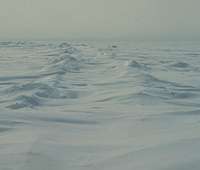 The
number of species that one finds in a sample decreases as one moves from
the equator to the poles. This is a well-known trend, and it is widely
known that the tropics contain more species than the arctic. Virtually
all groups of organisms follow this pattern, even those in the deep ocean.
This gradient goes back in geological time as far back as one can find
data for it. There are only a handful of known exceptions, such as the
marine algae of the Pacific coast of the Americas.
The
number of species that one finds in a sample decreases as one moves from
the equator to the poles. This is a well-known trend, and it is widely
known that the tropics contain more species than the arctic. Virtually
all groups of organisms follow this pattern, even those in the deep ocean.
This gradient goes back in geological time as far back as one can find
data for it. There are only a handful of known exceptions, such as the
marine algae of the Pacific coast of the Americas.
 One
reason for this pattern could be that the tropics receive more energy
from the sun, allowing for more biomass (the amount of living matter);
unfortunately more biomass doesn't necessarily need to lead to the increase
in species seen. Another reason could be that the more polar regions are
periodically ravaged by glaciers, resulting in a loss of species. The
rate at which new species evolve is slow enough that the polar areas never
manage to recover enough to reach the maximum number of species before
the glaciers return.
One
reason for this pattern could be that the tropics receive more energy
from the sun, allowing for more biomass (the amount of living matter);
unfortunately more biomass doesn't necessarily need to lead to the increase
in species seen. Another reason could be that the more polar regions are
periodically ravaged by glaciers, resulting in a loss of species. The
rate at which new species evolve is slow enough that the polar areas never
manage to recover enough to reach the maximum number of species before
the glaciers return.
 Diversity
falls as elevation increases. A 1000m increase in altitude results in
a temperature drop of about 6ºC. This is equivalent to moving 500 to 750
kilometres towards the pole (see the effect of latitude, above). This
drop in temperature and the greater seasonal variability at higher altitudes
are two major factors that reduce diversity at higher altitudes. Area
also typically decreases with increasing altitude; mountaintops are fairly
small, and this can also have an effect (see area, above).
Diversity
falls as elevation increases. A 1000m increase in altitude results in
a temperature drop of about 6ºC. This is equivalent to moving 500 to 750
kilometres towards the pole (see the effect of latitude, above). This
drop in temperature and the greater seasonal variability at higher altitudes
are two major factors that reduce diversity at higher altitudes. Area
also typically decreases with increasing altitude; mountaintops are fairly
small, and this can also have an effect (see area, above).
 Productivity
is the rate at which energy flows into an ecosystem; as the energy is
usually sunlight, productivity is more or less the rate of plant growth
in the system. More productive areas have more species, which is to be
expected. What is surprising, then, is that they only have more species
up to a point; areas with extremely high productivity have fewer species
than those that have more intermediate levels. The reasons for this hump-shaped
trend are not yet known.
Productivity
is the rate at which energy flows into an ecosystem; as the energy is
usually sunlight, productivity is more or less the rate of plant growth
in the system. More productive areas have more species, which is to be
expected. What is surprising, then, is that they only have more species
up to a point; areas with extremely high productivity have fewer species
than those that have more intermediate levels. The reasons for this hump-shaped
trend are not yet known.